Your bestseller is not automatically your best product to scale.
Revenue, margin, returns, inventory and advertising need to come together by SKU. Layer Insights shows which products support healthy growth and which only create volume.
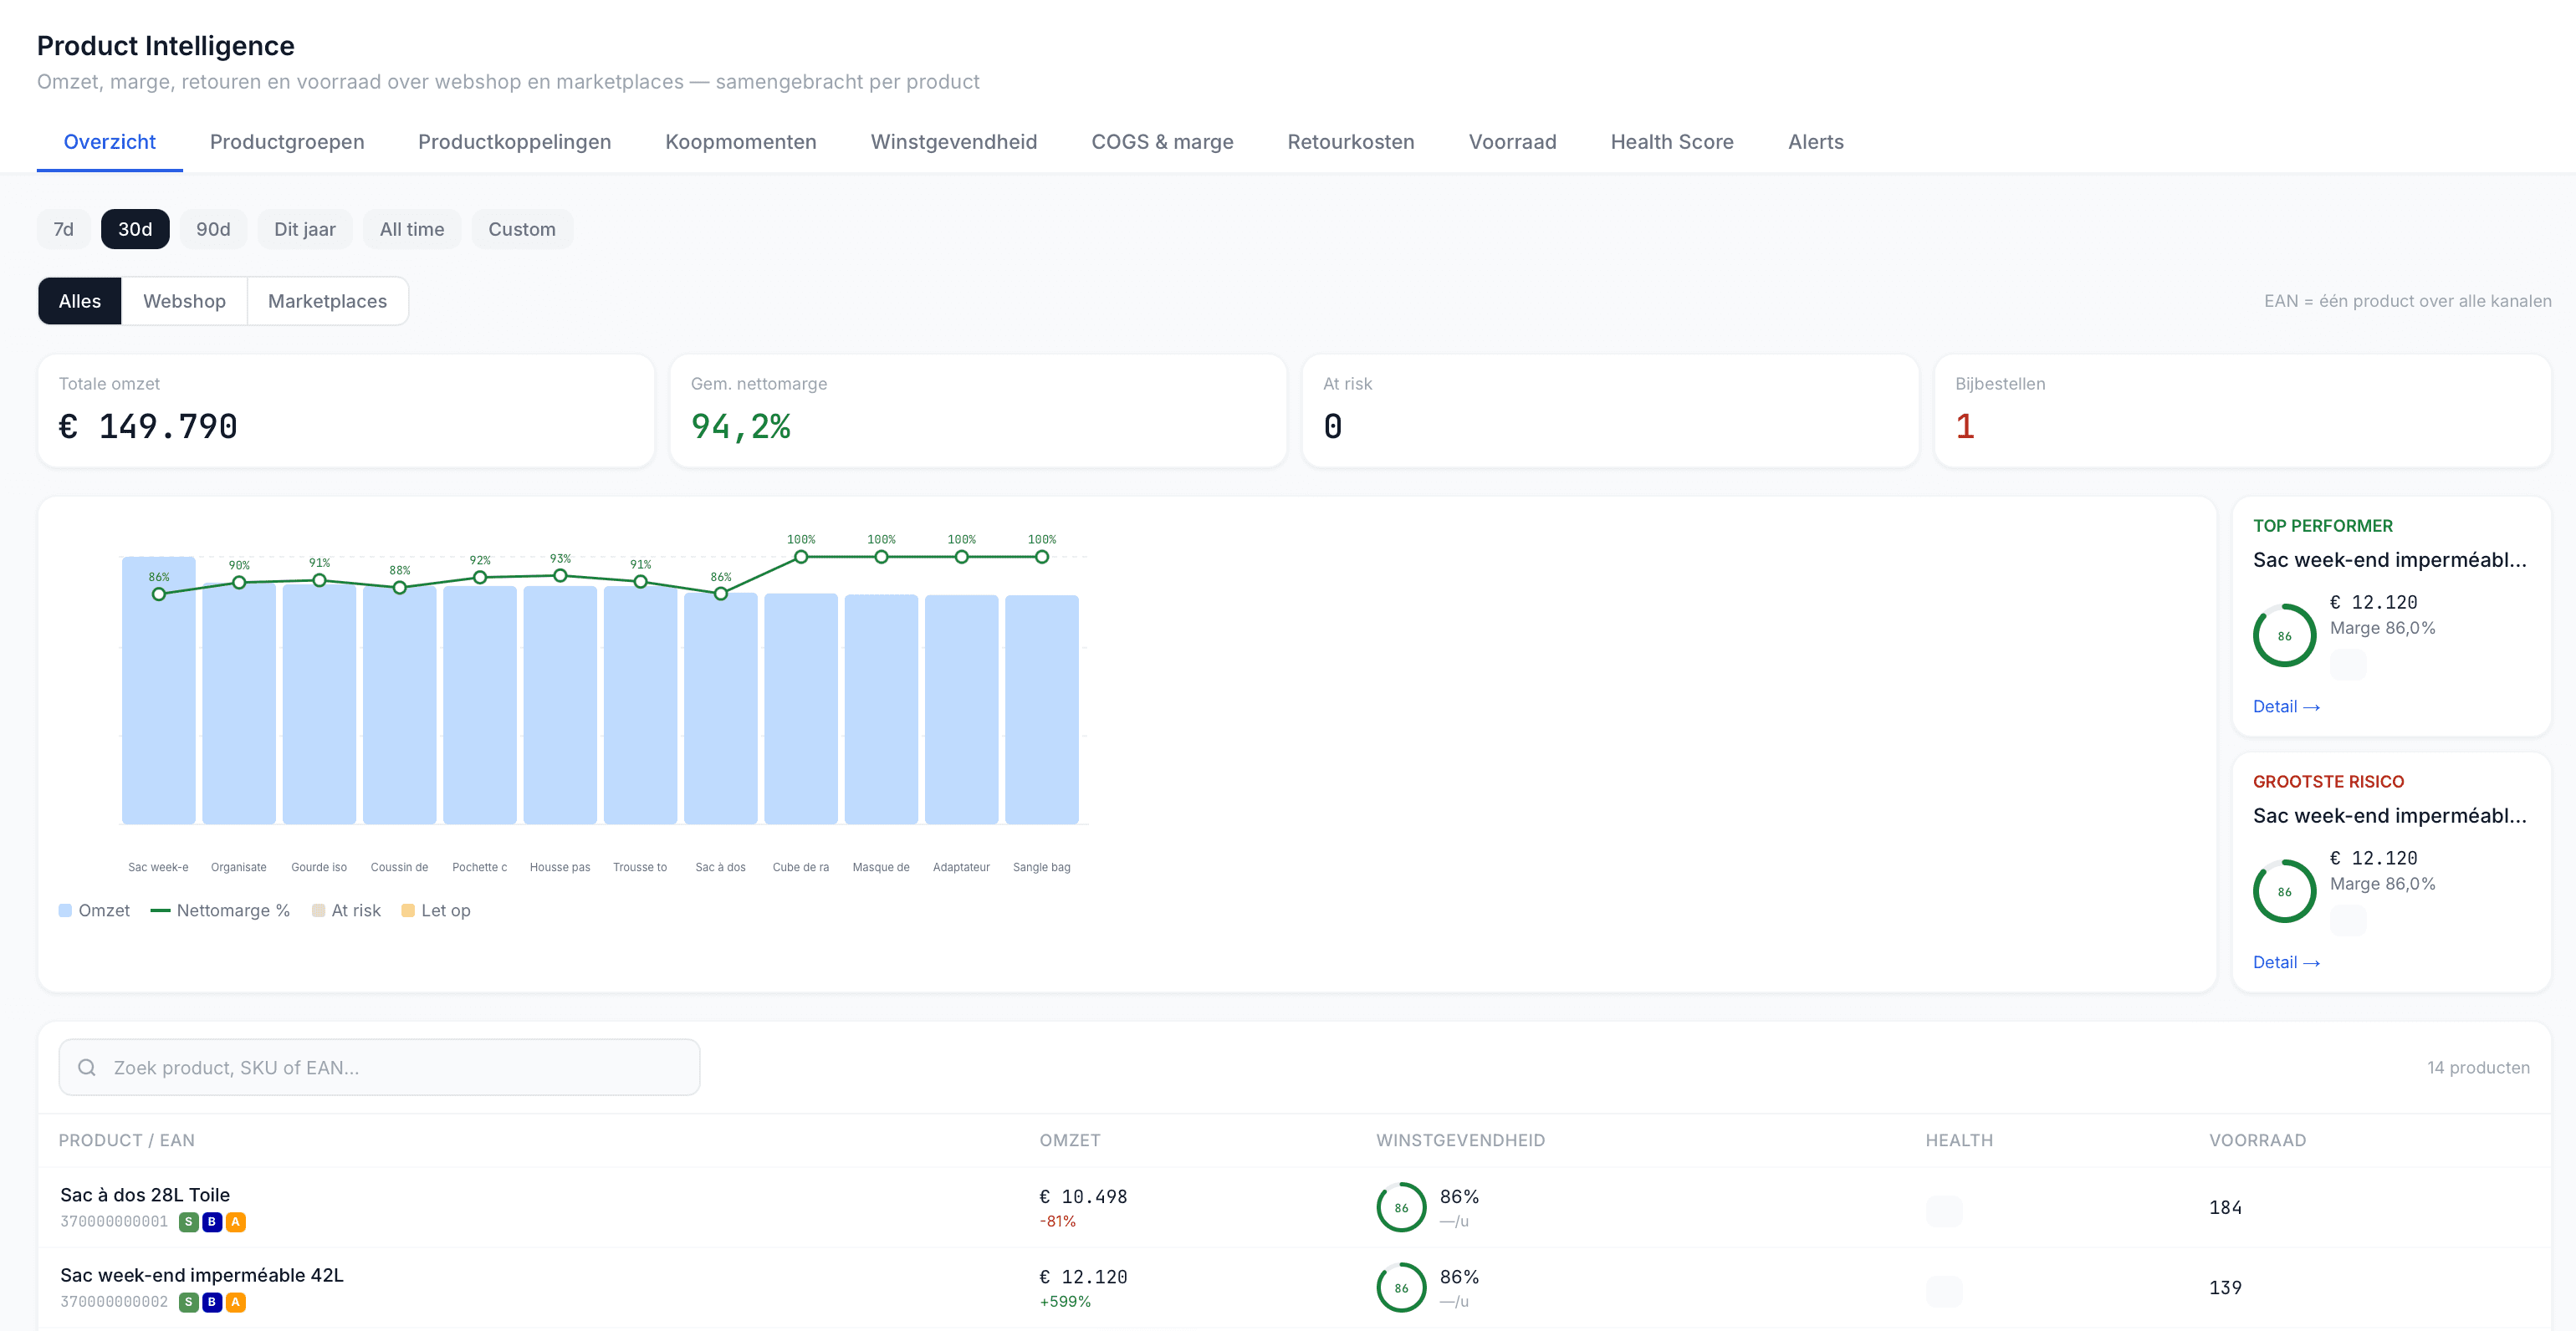
Product B sells slightly less but has fewer returns, higher margin and better repeat. That can be commercially more valuable.
Which SKU deserves more budget, inventory and attention?
Product intelligence makes merchandising and marketing part of the same decision.
Which SKU is growing healthily?
Combine revenue, margin, returns and spend.
Which bestseller is eating margin?
See where volume hides weak contribution.
Where is inventory or demand risk forming?
Put sell through and demand signals next to inventory.
Bring together · Explain · Decide
SKU data from commerce, costs, returns and advertising becomes one product view.
Product map
SKU, variant, EAN and channel IDs are mapped.
Economics
COGS, discounts, returns and fulfilment are added by product.
Demand
Search, ads and sales velocity add demand context.
Action
Scale winners, fix margin killers and plan inventory.
One product, multiple economic signals.
This prevents bestseller from automatically meaning winner.
| Signal | Strong product | Risk product |
|---|---|---|
| Contribution | Stable or rising | Falls with extra volume |
| Returns | Low and predictable | Rises with scale |
| CAC | Stays within target | Rises quickly |
| Stock | Enough coverage | Demand outgrows inventory |
Product and marketing should not have separate truths.
The best SKU to advertise is the one that remains healthy after all cost layers.
Budget
Push products with healthy unit economics and enough inventory.
Assortment
Review products that sell but structurally create weak contribution.
Inventory
Combine demand growth with sell through and lead time.
What you want to know before you start.
How do you match the same product across channels?
Use SKU, barcode, EAN and mapping rules so the same commercial entity stays recognizable.
Can returns be included in margin?
Yes. Return cost belongs in product economics rather than as a separate operations metric.
Go deeper on the decision logic.
Returns are destroying your margins and most brands are measuring them wrong
A 15 percent return rate sounds manageable until you calculate what it actually costs. Here is the full picture.
True landed cost: the COGS calculation most DTC brands get wrong
Your product cost is not just what you paid the factory. Every brand that underestimates COGS underestimates how much margin they are burning on growth.
Product page optimization: the six elements that drive 80% of conversion improvement
Most product page optimization projects start with the wrong question. The question is not "what should we add?" It is "what is stopping customers from buying right now?"
See which products carry growth and which hide its weakness.
Connect order and cost data for true SKU economics.