Revenue is growing. But what do you actually keep?
ROAS and revenue say little when COGS, fulfilment, returns, fees and discounts live separately. Layer Insights brings the economics back to the order, product and channel.
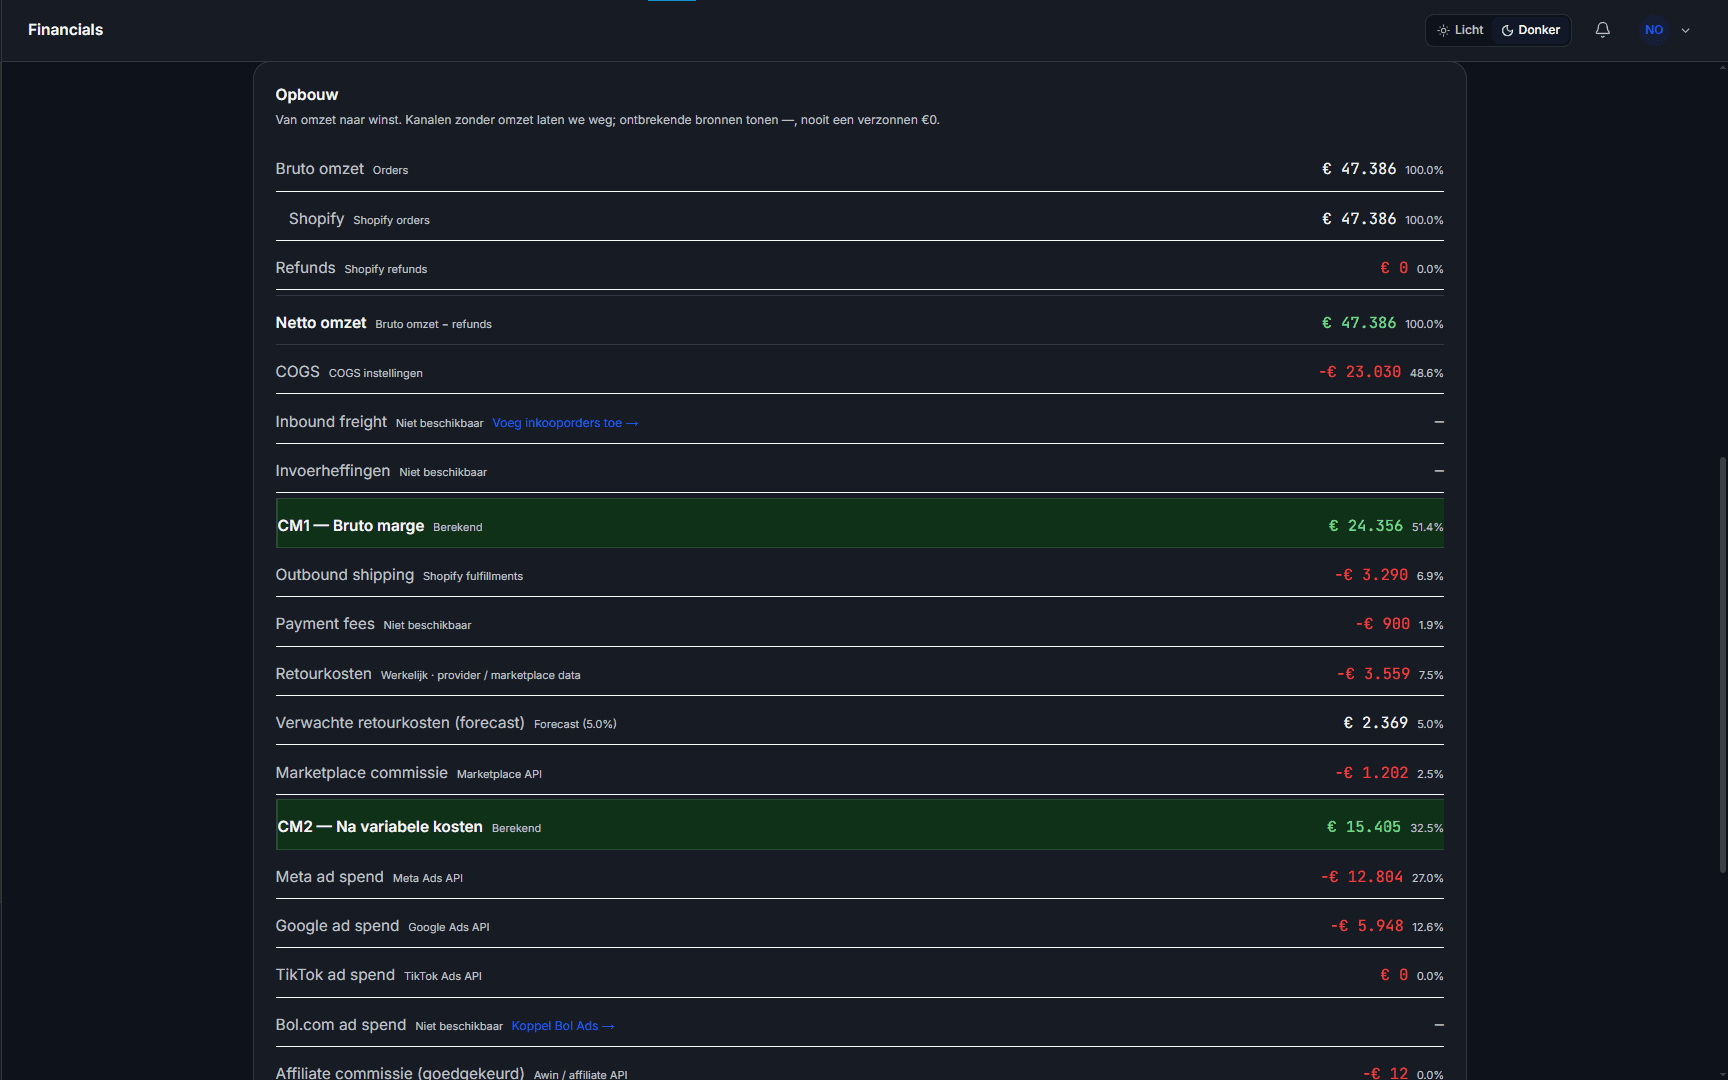
A campaign can grow revenue while lowering contribution margin. See which orders and products cause it.
See it before finance reports it at the end of the month.
Profit leakage usually sits in the combination of acquisition, product mix, discounting, returns and fulfilment.
Which revenue is worth having?
Compare revenue with contribution by channel, product and order.
Which products drag margin down?
See COGS, discounts, returns and fulfilment next to SKU revenue.
Where is growth becoming more expensive?
Track CAC and cost layers as volume rises.
Bring together · Explain · Decide
Order lines are enriched with product costs, fulfilment, channel costs, refunds and acquisition cost.
Net revenue
Start with revenue after discounts and refunds.
Product costs
Attach COGS and landed cost to the correct SKU.
Order costs
Add fulfilment, shipping and marketplace fees.
Contribution
Subtract acquisition and variable costs and steer on what remains.
Every cost layer belongs to the same order.
This prevents marketing, ecommerce and finance from working with three versions of profit.
| Layer | Example | Decision |
|---|---|---|
| Net revenue | After discount and refund | Which revenue really counts |
| COGS | Landed cost per SKU | Which products are healthy |
| Fulfilment | Pick pack, label and shipping | Which channels cost more |
| Acquisition | Spend connected to orders | Which growth costs too much |
| Contribution | After variable costs | Where extra budget pays |
From revenue report to profit decision.
The question is not whether something sells, but whether it sells profitably.
Slow campaigns
Reduce spend when revenue rises but contribution falls below your threshold.
Change product mix
Push products with stronger contribution and fewer returns.
Adjust channel mix
Compare website and marketplaces on the same economic basis.
What you want to know before you start.
What if COGS is incomplete?
Show coverage and only use defensible costs. Missing cost layers remain visible.
Why contribution instead of just gross margin?
Contribution includes more variable costs that change directly when you buy more revenue.
Go deeper on the decision logic.
Contribution margin per channel: the number your agency will not show you
ROAS tells you revenue per euro spent. Contribution margin tells you profit per euro spent. They often point in opposite directions. Here is how to calculate the one that actually matters.
True landed cost: the COGS calculation most DTC brands get wrong
Your product cost is not just what you paid the factory. Every brand that underestimates COGS underestimates how much margin they are burning on growth.
Returns are destroying your margins and most brands are measuring them wrong
A 15 percent return rate sounds manageable until you calculate what it actually costs. Here is the full picture.
Stop letting revenue and profit tell two different stories.
Connect order and cost data to see where margin is actually created and lost.